Performance Overview
A compelling reason to use React Native instead of WebView-based tools is to achieve at least 60 frames per second and provide a native look and feel to your apps. Whenever feasible, we aim for React Native to handle optimizations automatically, allowing you to focus on your app without worrying about performance. However, there are certain areas where we haven't quite reached that level yet, and others where React Native (similar to writing native code directly) cannot determine the best optimization approach for you. In such cases, manual intervention becomes necessary. We strive to deliver buttery-smooth UI performance by default, but there may be instances where that isn't possible.
This guide is intended to teach you some basics to help you to troubleshoot performance issues, as well as discuss common sources of problems and their suggested solutions.
What you need to know about frames
Your grandparents' generation called movies "moving pictures" for a reason: realistic motion in video is an illusion created by quickly changing static images at a consistent speed. We refer to each of these images as frames. The number of frames that is displayed each second has a direct impact on how smooth and ultimately life-like a video (or user interface) seems to be. iOS and Android devices display at least 60 frames per second, which gives you and the UI system at most 16.67ms to do all of the work needed to generate the static image (frame) that the user will see on the screen for that interval. If you are unable to do the work necessary to generate that frame within the allotted time slot, then you will "drop a frame" and the UI will appear unresponsive.
Now to confuse the matter a little bit, open up the Dev Menu in your app and toggle Show Perf Monitor. You will notice that there are two different frame rates.
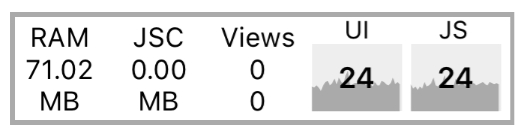
JS frame rate (JavaScript thread)
For most React Native applications, your business logic will run on the JavaScript thread. This is where your React application lives, API calls are made, touch events are processed, and more. Updates to native-backed views are batched and sent over to the native side at the end of each iteration of the event loop, before the frame deadline (if all goes well). If the JavaScript thread is unresponsive for a frame, it will be considered a dropped frame. For example, if you were to set a new state on the root component of a complex application and it resulted in re-rendering computationally expensive component subtrees, it's conceivable that this might take 200ms and result in 12 frames being dropped. Any animations controlled by JavaScript would appear to freeze during that time. If enough frames are dropped, the user will feel it.
An example is responding to touches: if you are doing work across multiple frames on the JavaScript thread, you might notice a delay in responding to TouchableOpacity, for example. This is because the JavaScript thread is busy and cannot process the raw touch events sent over from the main thread. As a result, TouchableOpacity cannot react to the touch events and command the native view to adjust its opacity.
UI frame rate (main thread)
You may have noticed that performance of native stack navigators (such as the @react-navigation/native-stack provided by React Navigation) is better out of the box than JavaScript-based stack navigators. This is because the transition animations are executed on the native main UI thread, so they are not interrupted by frame drops on the JavaScript thread.
Similarly, you can happily scroll up and down through a ScrollView when the JavaScript thread is locked up because the ScrollView lives on the main thread. The scroll events are dispatched to the JS thread, but their receipt is not necessary for the scroll to occur.
Common sources of performance problems
Running in development mode (dev=true)
JavaScript thread performance suffers greatly when running in dev mode. This is unavoidable: a lot more work needs to be done at runtime to provide you with good warnings and error messages. Always make sure to test performance in release builds.
Using console.log statements
When running a bundled app, these statements can cause a big bottleneck in the JavaScript thread. This includes calls from debugging libraries such as redux-logger, so make sure to remove them before bundling. You can also use this babel plugin that removes all the console.* calls. You need to install it first with npm i babel-plugin-transform-remove-console --save-dev, and then edit the .babelrc file under your project directory like this:
{
  "env": {
    "production": {
      "plugins": ["transform-remove-console"]
    }
  }
}
This will automatically remove all console.* calls in the release (production) versions of your project.
It is recommended to use the plugin even if no console.* calls are made in your project. A third party library could also call them.
FlatList rendering is too slow or scroll performance is bad for large lists
If your FlatList is rendering slowly, be sure that you've implemented getItemLayout to optimize rendering speed by skipping measurement of the rendered items.
There are also other third-party list libraries that are optimized for performance, including FlashList and Legend List.
Dropping JS thread FPS because of doing a lot of work on the JavaScript thread at the same time
"Slow Navigator transitions" is the most common manifestation of this, but there are other times this can happen. Using InteractionManager can be a good approach, but if the user experience cost is too high to delay work during an animation, then you might want to consider LayoutAnimation.
The Animated API currently calculates each keyframe on-demand on the JavaScript thread unless you set useNativeDriver: true, while LayoutAnimation leverages Core Animation and is unaffected by JS thread and main thread frame drops.
One case for using this is animating in a modal (sliding down from top and fading in a translucent overlay) while initializing and perhaps receiving responses for several network requests, rendering the contents of the modal, and updating the view where the modal was opened from. See the Animations guide for more information about how to use LayoutAnimation.
Caveats:
LayoutAnimationonly works for fire-and-forget animations ("static" animations) -- if it must be interruptible, you will need to useAnimated.
Moving a view on the screen (scrolling, translating, rotating) drops UI thread FPS
This is especially true on Android when you have text with a transparent background positioned on top of an image, or any other situation where alpha compositing would be required to re-draw the view on each frame. You will find that enabling renderToHardwareTextureAndroid can help with this significantly. For iOS, shouldRasterizeIOS is already enabled by default.
Be careful not to overuse this or your memory usage could go through the roof. Profile your performance and memory usage when using these props. If you don't plan to move a view anymore, turn this property off.
Animating the size of an image drops UI thread FPS
On iOS, each time you adjust the width or height of an Image component it is re-cropped and scaled from the original image. This can be very expensive, especially for large images. Instead, use the transform: [{scale}] style property to animate the size. An example of when you might do this is when you tap an image and zoom it in to full screen.
My TouchableX view isn't very responsive
Sometimes, if we do an action in the same frame that we are adjusting the opacity or highlight of a component that is responding to a touch, we won't see that effect until after the onPress function has returned. This may occur if onPress sets a state that results in a heavy re-render and a few frames are dropped as a result. A solution to this is to wrap any action inside of your onPress handler in requestAnimationFrame:
function handleOnPress() {
  requestAnimationFrame(() => {
    this.doExpensiveAction();
  });
}